- Surveys & Programs
- Data & Tools
- Fast Facts
- News & Events
- Publications & Products
- About Us

Indicator 19: College Participation Rates
(Last Updated: February 2019)
From 2000 to 2016, total college enrollment rates increased for White (from 39 to 42 percent), Black (from 31 to 36 percent), and Hispanic young adults (from 22 to 39 percent). The 2016 total college enrollment rate for American Indian/Alaska Native young adults (19 percent) was not measurably different from their 2000 rate. Also, the 2016 rates for Asian young adults (58 percent), young adults of Two or more races (42 percent), and Pacific Islander young adults (21 percent) were not measurably different from the corresponding rates in 2003, when the collection of separate data on Asian and Pacific Islander young adults began.
The percentage of 18- to 24-year-olds enrolled in college has increased since 2000. College participation can be measured and described in terms of the total college enrollment rate, as well as the immediate college enrollment rate. The total college enrollment rate is defined as the percentage of all 18- to 24-year-olds (referred to as “young adults” in this indicator) enrolled as undergraduate or graduate students in 2- or 4-year colleges and universities. The immediate college enrollment rate is discussed later in this indicator.
Figure 19.1. Percentage of 18- to 24-year-olds enrolled in college, by race/ethnicity: 2000, 2003, 2010, and 2016

— Not available.
! Interpret data with caution. The coefficient of variation (CV) for this estimate is between 30 and 50 percent.
NOTE: Data are based on sample surveys of the civilian noninstitutionalized population. Totals include other racial/ethnic groups not separately shown. Separate data for Asians, Pacific Islanders, and persons of Two or more races were not available in 2000. After 2002, data for individual race categories exclude persons of Two or more races. Race categories exclude persons of Hispanic ethnicity. Although rounded numbers are displayed, the figures are based on unrounded estimates.
SOURCE: U.S. Department of Commerce, Census Bureau, Current Population Survey (CPS), October, 2000, 2003, 2010, and 2016. See Digest of Education Statistics 2017, table 302.60.
The total college enrollment rate for young adults overall increased from 35 percent in 2000 to 41 percent in 2016, though the 2016 rate was not measurably different from the 2010 rate. From 2000 to 2016, total college enrollment rates increased for White (from 39 to 42 percent), Black (from 31 to 36 percent), and Hispanic young adults (from 22 to 39 percent). The 2016 total college enrollment rate for American Indian/Alaska Native young adults (19 percent) was not measurably different from their 2000 rate. Also, the 2016 rates for Asian young adults (58 percent), young adults of Two or more races (42 percent), and Pacific Islander young adults (21 percent) were not measurably different from the corresponding rates in 2003.1 More recently, total college enrollment rates were higher for Hispanic young adults in 2016 than in 2010 (39 vs. 32 percent) and lower for American Indian/Alaska Native young adults (19 vs. 41 percent), but not measurably different for young adults in the other racial/ethnic groups.
In 2016, the total college enrollment rate was higher for Asian young adults (58 percent) than for young adults who were of Two or more races (42 percent), White (42 percent), Hispanic (39 percent), Black (36 percent), Pacific Islander (21 percent), and American Indian/Alaska Native (19 percent). Enrollment rates in 2016 were also higher for White and Hispanic young adults and those of Two or more races than for Pacific Islander and American Indian/Alaska Native young adults. Additionally, the rate for Black young adults was higher than the rate for American Indian/Alaska Native young adults.
Figure 19.2. Percentage of 18- to 24-year-olds enrolled in college, by race/ethnicity: 2000–2016
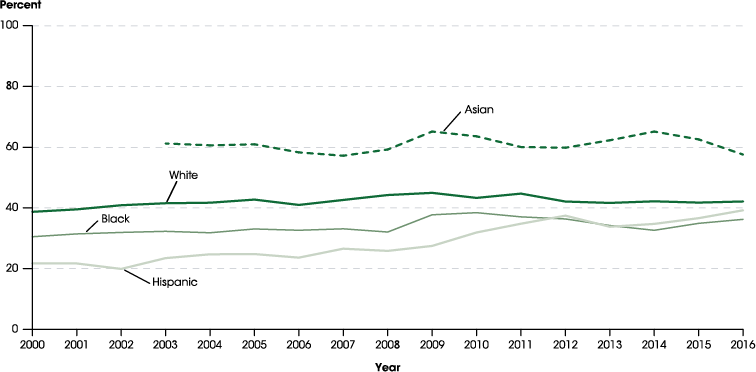
NOTE: Data are based on sample surveys of the civilian noninstitutionalized population. Separate data for Asian 18- to 24-year-olds were not available until 2003. After 2002, individual race categories exclude persons identifying as Two or more races. Race categories exclude persons of Hispanic ethnicity.
SOURCE: U.S. Department of Commerce, Census Bureau, Current Population Survey (CPS), October, 2000 through 2016. See Digest of Education Statistics 2017, table 302.60.
From 2003 to 2016, the Asian-Hispanic gap in total college enrollment rates narrowed, from 38 to 18 percentage points. The Asian-Black gap in total college enrollment rates was smaller in 2016 (21 percentage points) than in 2003 (29 percentage points). From 2000 to 2016, the White-Hispanic gap in total college enrollment rates also narrowed: while the rate for White young adults was 17 percentage points higher than the rate for Hispanic young adults in 2000, there was no measurable difference between the two rates in 2016. The White-Black gap in total college enrollment rate in 2016 (6 percentage points) was not measurably different than the corresponding gap in 2000.
Figure 19.3. Percentage of 18- to 24-year-olds enrolled in college, by sex and race/ethnicity: 2000 and 2016

NOTE: Data are based on sample surveys of the civilian noninstitutionalized population. Totals include other racial/ethnic groups not separately shown. In 2000, data for individual race categories include persons of Two or more races. Race categories exclude persons of Hispanic ethnicity. Although rounded numbers are displayed, the figures are based on unrounded estimates.
SOURCE: U.S. Department of Commerce, Census Bureau, Current Population Survey (CPS), October, 2000 and 2016. See Digest of Education Statistics 2017, table 302.60.
Between 2000 and 2016, college enrollment rates increased overall for both young adult males (from 33 to 39 percent) and young adult females (from 38 to 44 percent). Among young adult males, enrollment rates were higher in 2016 than in 2000 for those who were White (40 vs. 36 percent), Black (33 vs. 25 percent), and Hispanic (35 vs. 18 percent). Among young adult females, rates were also higher for those who were White (44 vs. 41 percent) and Hispanic (44 vs. 25 percent). However, the rate for Black young adult females in 2016 (39 percent) was not measurably different from the rate in 2000.
In every year since 2000, college enrollment rates among young adults were higher for females than for males. This pattern was also observed for White and Hispanic young adults among the racial/ethnic groups examined. For example, in 2016 the male-female gap in total college enrollment rate was 5 percentage points for young adults overall, 5 percentage points for White young adults, and 9 percentage points for Hispanic young adults. Among Black young adults, in 2000 the enrollment rate for females (35 percent) was 10 percentage points higher than the rate for males (25 percent); however, there was no measurable difference between the two rates in 2016.
Figure 19.4. Percentage of high school completers who were enrolled in college by the fall immediately following high school completion, by race/ethnicity: 2000–2016

NOTE: Estimates are based on individuals ages 16 to 24 who graduated from high school or completed a GED or other high school equivalency credential. Percentages for racial/ethnic groups are based on moving averages, which are used to produce more stable estimates. A 3-year moving average is a weighted average of the year indicated, the year immediately preceding, and the year immediately following. Three-year moving averages are presented in all but two instances: the moving average for Asian data in 2003 reflects an average of 2003 and 2004 data, and the moving average for 2016 reflects an average of 2015 and 2016 data. High school completers include GED recipients. Separate data on Asian high school completers have been collected since 2003. From 2003 onward, White, Black, and Asian data exclude persons identifying as Two or more races. Prior to 2003, each respondent could select only a single race category, and the “Two or more races” category was not reported. Total includes other racial/ethnic groups not separately shown, including Pacific Islander, American Indian/Alaska Native, and Two or more races. Race categories exclude persons of Hispanic ethnicity.
SOURCE: U.S. Department of Commerce, Census Bureau, Current Population Survey (CPS), October, 2000 through 2016. See Digest of Education Statistics 2017, table 302.20.
The immediate college enrollment rate is defined as the annual percentage of high school completers (referred to as “students” in this indicator), including GED recipients, who enroll in 2- or 4-year colleges and universities in the fall immediately following high school completion. Similar to the pattern observed for the overall total college enrollment rate, the overall immediate college enrollment rate increased from 63 percent in 2000 to 70 percent in 2016, though the 2016 rate was not measurably different from the 2010 rate. The immediate college enrollment rate for White students was higher in 2016 (71 percent)2 than in 2000 (65 percent), and the rate for Asian students was higher in 2016 (87 percent) than in 2003 (74 percent).3 For both White and Asian students, the immediate college enrollment rate increased until 2010, then fluctuated from 2010 to 2016. For Hispanic students, the immediate enrollment rate increased from 49 percent in 2000 to 71 percent in 2016. For Black students, the immediate college enrollment rate increased from 56 percent in 2000 to 66 percent in 2010, then decreased back to 56 percent in 2016.
In 2016, the immediate college enrollment rate for Asian students (87 percent) was higher than the rates for Hispanic (71 percent), White (71 percent), and Black (56 percent) students. Additionally, the rates for White and Hispanic students were higher than the rate for Black students.
From 2003 to 2016, the Asian-White gap in immediate college enrollment rates widened, from 6 to 17 percentage points. The Asian-Black gap in immediate college enrollment rates was larger in 2016 (31 percentage points) than in 2003 (14 percentage points). The Asian-Hispanic gap in immediate college enrollment rate in 2016 (17 percentage points) was not measurably different than the corresponding gap in 2003. From 2000 to 2016, the White-Hispanic gap in immediate college enrollment rates narrowed: while the rate for White students was 17 percentage points higher than the rate for Hispanic students in 2000, there was no measurable difference between the two rates in 2016. The White-Black gap in immediate college enrollment rate in 2016 (14 percentage points) was not measurably different than the corresponding gap in 2000.
Endnotes
1 Prior to 2003, data were collected for the combined race category of Asian/Pacific Islander young adults, and separate data for young adults of Two or more races were not collected.
2 Percentages for racial/ethnic groups are based on moving averages, which are used to produce more stable estimates. A 3-year moving average is a weighted average of the year indicated, the year immediately preceding, and the year immediately following. Three-year moving averages are presented in all but two instances: the moving average for Asian data in 2003 reflects an average of 2003 and 2004 data, and the moving average for 2016 reflects an average of 2015 and 2016 data.
3 Prior to 2003, data were collected for the combined race category of Asian/Pacific Islander students.
Reference Tables
- Table 302.20 (Digest of Education Statistics 2017) Percentage of recent high school completers enrolled in college, by race/ethnicity: 1960 through 2016
- Table 302.60 (Digest of Education Statistics 2017) Percentage of 18- to 24-year-olds enrolled in college, by level of institution and sex and race/ethnicity of student: 1970 through 2016
Related Indicators and Resources
College Enrollment Rates (The Condition of Education); Immediate College Enrollment Rate (The Condition of Education)
Data Sources
Current Population Survey (CPS)


